

What is Pandas?
Pandas is a Python library for performing data exploration, manipulation and analysis that allows you to work with data in easy-to-use Panda data structures, namely DataFrames. Pandas' popularity can be thanked based on its ease of use, flexibility and support in helping data scientists work with large data sets.
Features
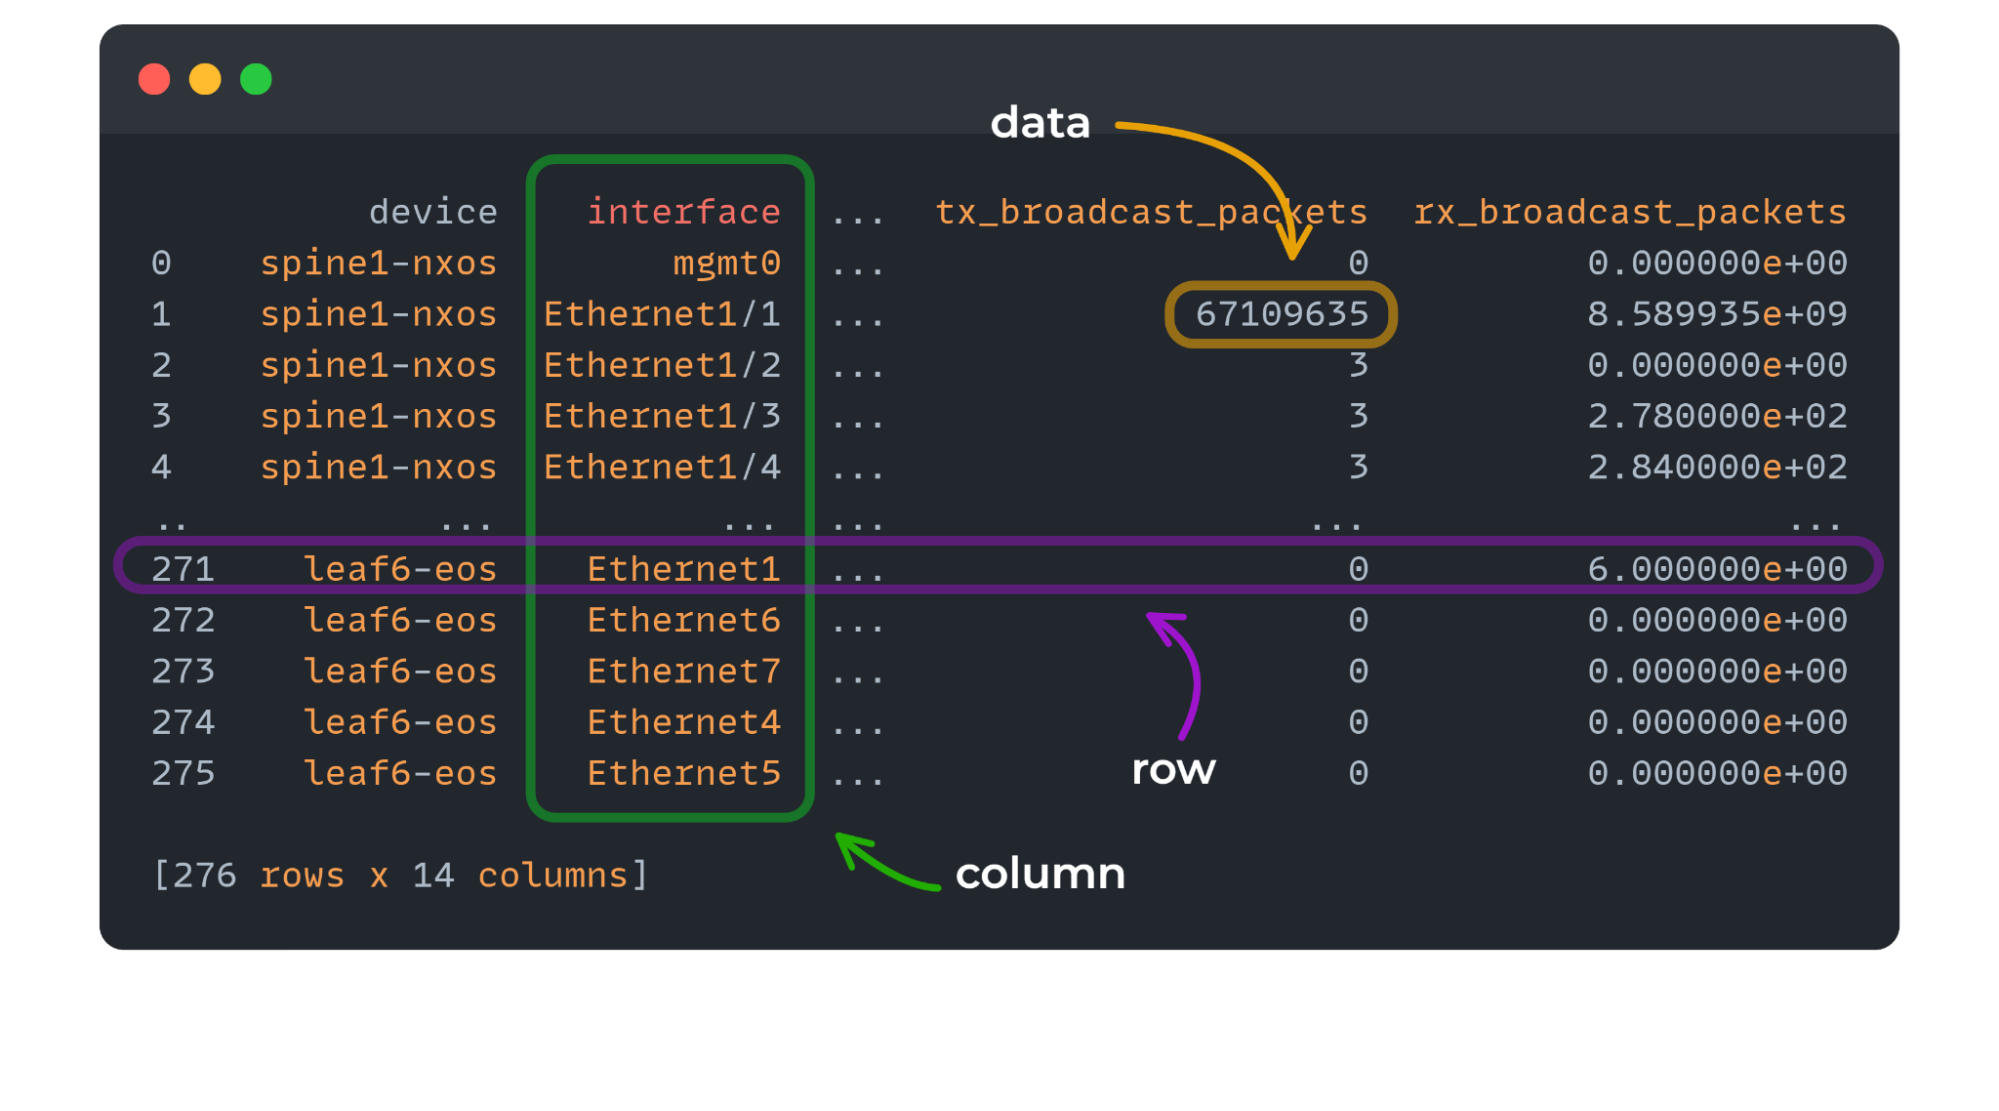
The key thing Pandas provides is a Python data structure called a DataFrame (example below). A DataFrame:
- Consists of rows and columns
- Similar to a spreadsheet, i.e. rows, columns (but easier to work with programmatically).
- Provides an extensive range of methods and attributes to allow filtering, merging and data processing operations.
- Offers great data format support for converting to and from a DataFrame.
Why is Pandas Useful for Network Automation?
Here are some examples of how we can use Pandas in the world of network automation:
- Using a DataFrame within your network tests (pyATS, Pytest, etc) eases the process of working within the data, thanks to Pandas query methods, instead of using a jungle of nested loops and lookups.
- Great for performing network differentials, which can be achieved via the
mergefeature. - Due to its strong data format support, DataFrames can be exported into Excel, HTML, Markdown, etc. Allowing for easy report generation.
Installation
To install pandas we perform:
pip install pandas
Or if we you are using Poetry:
poetry add pandas
Creating a DataFrame
DataFrames can be created using data from various sources/formats, such as JSON, CSV, Python dictionaries, and Excel.
Lets create a DataFrame using a Python dictionary consisting of interface data collected from an Arista device using Netmiko and TextFSM.
Data Collection
# Note: you will need to install netmiko first:
# - pip install netmiko
from netmiko import ConnectHandler

device = {
    "device_type": "arista_eos",
    "host": "172.29.151.7",
    "username": "lab",
    "password": "abc123",
    "fast_cli": False,
}

with ConnectHandler(**device) as conn:
    interface_data = conn.send_command("show interfaces", use_textfsm=True)
Create DataFrame
Now we can create our DataFrame like so:
import pandas as pd

df = pd.DataFrame(interface_data)
To see our DataFrame we can simply perform a print:
>>> print(df)
   interface link_status protocol_status hardware_type  ...    mtu bandwidth                          interface_up_time link_status_change
0  Ethernet1          up  up (connected)      Ethernet  ...   1500            17 days, 15 hours, 30 minutes, 54 seconds                  2
1  Ethernet2          up  up (connected)      Ethernet  ...   1500            17 days, 15 hours, 30 minutes, 54 seconds                  2
2  Ethernet3          up  up (connected)      Ethernet  ...   9214            17 days, 15 hours, 30 minutes, 54 seconds                  2
3  Ethernet4          up  up (connected)      Ethernet  ...   9214            17 days, 15 hours, 30 minutes, 54 seconds                  2
4  Ethernet5          up  up (connected)      Ethernet  ...   9214            17 days, 15 hours, 30 minutes, 54 seconds                  2
5  Ethernet6          up  up (connected)      Ethernet  ...   9214            17 days, 15 hours, 30 minutes, 54 seconds                  2
6  Ethernet7          up  up (connected)      Ethernet  ...   9214            17 days, 15 hours, 30 minutes, 54 seconds                  2
7  Ethernet8          up  up (connected)      Ethernet  ...   9214            17 days, 15 hours, 30 minutes, 55 seconds                  2
8  Loopback0          up  up (connected)      Loopback  ...  65535            17 days, 15 hours, 31 minutes, 14 seconds
We can see some truncation of our columns. To see all the available fields for a row you can use iloc, like so. This will show us a row in a vertical based manner.
>>> df.iloc[0]
interface                                             Ethernet1
link_status                                                  up
protocol_status                                  up (connected)
hardware_type                                          Ethernet
mac_address                                      5000.00e4.7294
bia
description
ip_address                                          10.1.5.2/30
mtu                                                        1500
bandwidth
interface_up_time     17 days, 15 hours, 30 minutes, 54 seconds
link_status_change                                            2
Name: 0, dtype: object
Data Exploration
Now that our data is within a DataFrame, we are spoiled with many different methods and options for working with our data. In this post we will simply show you the query method, which will filter our DataFrame based on column names and values using quality operators.
First let's see which interfaces are not up.
>>> df.query('link_status != "up"')
Empty DataFrame
Columns: [interface, link_status, protocol_status, hardware_type, mac_address, bia, description, ip_address, mtu, bandwidth, interface_up_time, link_status_change]
Index: []
As we can see, the result is empty. Great!
Let's now filter which interfaces are greater than 1500. However, we have a problem. The mtu column is defined as a string-based type rather then integer. Lets change this:
df["mtu"] = df["mtu"].astype(int)
We can now perform our mtu query.
>>> df.query('mtu > 1500')
    interface link_status protocol_status hardware_type  ...    mtu bandwidth                          interface_up_time link_status_change
 2  Ethernet3          up  up (connected)      Ethernet  ...   9214            17 days, 15 hours, 30 minutes, 54 seconds                  2
 3  Ethernet4          up  up (connected)      Ethernet  ...   9214            17 days, 15 hours, 30 minutes, 54 seconds                  2
 4  Ethernet5          up  up (connected)      Ethernet  ...   9214            17 days, 15 hours, 30 minutes, 54 seconds                  2
 5  Ethernet6          up  up (connected)      Ethernet  ...   9214            17 days, 15 hours, 30 minutes, 54 seconds                  2
 6  Ethernet7          up  up (connected)      Ethernet  ...   9214            17 days, 15 hours, 30 minutes, 54 seconds                  2
 7  Ethernet8          up  up (connected)      Ethernet  ...   9214            17 days, 15 hours, 30 minutes, 55 seconds                  2
 8  Loopback0          up  up (connected)      Loopback  ...  65535            17 days, 15 hours, 31 minutes, 14 seconds
 [7 rows x 12 columns]
Exporting a DataFrame
Finally, we can export our DataFrame. We can export it as a CSV, Excel, HTML and many other formats.
Lets export this as CSV, and also HTML.
First CSV:
df.to_csv("interface_data.csv", index=False)
# Output of interface_data.csv file
# interface,link_status,protocol_status,hardware_type,mac_address,bia,description,ip_address,mtu,bandwidth,interface_up_time,link_status_change
# Ethernet1,up,up (connected),Ethernet,5000.00e4.7294,,,10.1.5.2/30,1500,,"17 days, 15 hours, 30 minutes, 54 seconds",2
# Ethernet2,up,up (connected),Ethernet,5000.00e4.7294,,,10.2.5.2/30,1500,,"17 days, 15 hours, 30 minutes, 54 seconds",2
# Ethernet3,up,up (connected),Ethernet,5000.0007.0003,5000.0007.0003,,,9214,,"17 days, 15 hours, 30 minutes, 54 seconds",2
# Ethernet4,up,up (connected),Ethernet,5000.0007.0004,5000.0007.0004,,,9214,,"17 days, 15 hours, 30 minutes, 54 seconds",2
# Ethernet5,up,up (connected),Ethernet,5000.0007.0005,5000.0007.0005,,,9214,,"17 days, 15 hours, 30 minutes, 54 seconds",2
# Ethernet6,up,up (connected),Ethernet,5000.0007.0006,5000.0007.0006,,,9214,,"17 days, 15 hours, 30 minutes, 54 seconds",2
# Ethernet7,up,up (connected),Ethernet,5000.0007.0007,5000.0007.0007,,,9214,,"17 days, 15 hours, 30 minutes, 54 seconds",2
# Ethernet8,up,up (connected),Ethernet,5000.0007.0008,5000.0007.0008,,,9214,,"17 days, 15 hours, 30 minutes, 55 seconds",2
# Loopback0,up,up (connected),Loopback,,,,5.5.5.5/32,65535,,"17 days, 15 hours, 31 minutes, 14 seconds",
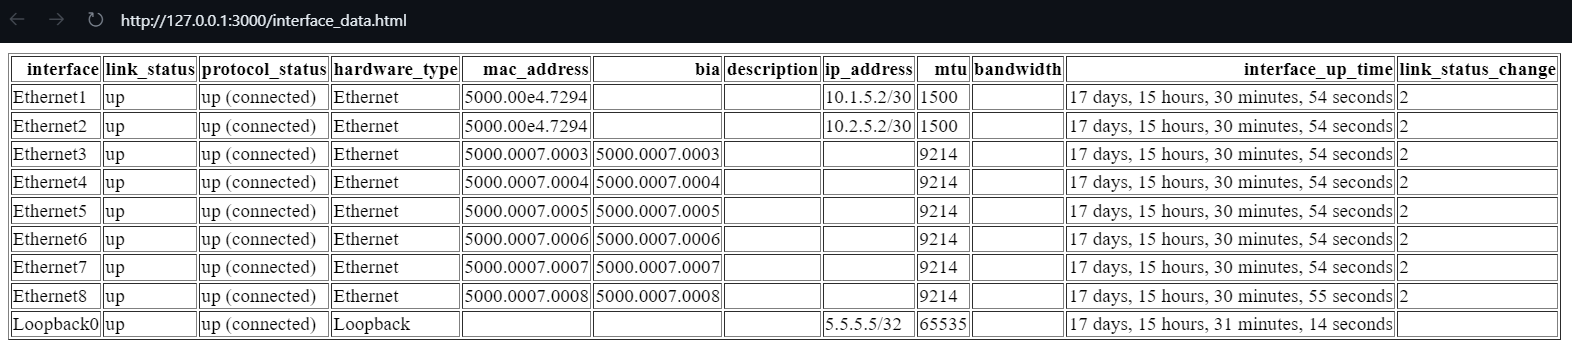
Now lets export to HTML:
df.to_html("interface_data.html", index=False)
Here's the HTML-generated file via the browser:
That wraps up this Introduction to Pandas. I hope you`ve found it useful and can see the possibilities of using Pandas when automating your network.
Looking to Learn More? If so check out our Pandas course (link below):
 Rick Donato