
Today, we will look at a new tool to hit the market named Slurp'it. Which defines itself as:
a powerful and easy-to-use network discovery solution ...
That sounds great, right? But what exactly does this mean? We will look at some of Slurp'it's features, the use cases it can help with, and what you need to know to get started.
Let's dive in!
What is Slurp'it?
Slurp'it is a network discovery tool. At a high level, it is a point-based solution, i.e., it has a single focus on network discovery. This includes discovering network devices and collecting network data, which is stored in a database. This data can then be consumed and queried using either the Slurp'it UI or REST API.
For Slurp`it to collect data from the network, it needs to know about the network devices (IPs, platform type etc.) it should reach out to. Therefore Slurp`it provides various options for adding devices to the inventory. Such as:
- Manual input,
- CSV or API import,
- The Slurp'it Device Finder, which dynamically finds devices using SNMP.
When it comes to the Slurp'it Device Finder, it provides two options:
- Finder: Scan a set of provided networks using SNMP, to discover new devices.
- Crawler: Using IPs within previously collected data, it performs an SNMP against these IPs to discover new devices.
Once Slurp'it knows about the devices within the network, Slurp'it will connect out to these devices and discover the main protocols and features of the devices, such as:
- ARP
- CDP
- Clock
- Hardware info
- Interfaces
- LLDP
- Mac addresses
- Routing Table
- Software versions
- Vlans
A point-based solution is a tool that has a single role and focus. It does one thing and one thing well. Point-based solutions are intended for integration with other systems. A great example of point-based is in the world of Linux and commands such as cat, ls, sed, etc. All of which are point-based. Each of these do one thing and one thing well. Furthermore, they are designed to be chained together (in this case, pipes; |) to achieve broader use cases. The result of this approach is a highly flexible and efficient system where users can combine simple, focused tools in various ways to achieve their required use case.
Under the hood, Slurp'it connects to the devices and runs various show commands. These show commands are then parsed into a structured format and saved to its database (diagram below). To achieve this, Slurp'it utilises two open-source projects: Netmiko and TextFSM.
- Netmiko - To connect out to the devices via SSH and run the required show commands.
- TextFSM - To parse the raw text into structured text. TextFSM uses parsing templates to define the "instructions" for how TextFSM should convert the raw text to structured text.
Structured text is a term used to describe the representation of data that can be easily consumed in a programmatic manner, such as key lookups. An example of structured text is JSON.
Through the use of these TextFSM templates, Slurp'it allows you to customise/add to what is collected by default. Also, as Netmiko is used as the underlying SSH CLI scraper, all of the vendors supported by Netmiko are also supported by Slurp'it (at the time of writing, this is ~110).
Slurp'it Use-Cases
Slurp'it lends itself to 2 main use cases. These are Reporting and Automation.
Reporting
Querying the collected data centrally using the UI. This is extremely useful for NetOp teams that do not necessarily want to “write code” to get answers to the questions that they may have. Such as:
Which interfaces on device x are down?
Automation
Using the discovered data (via the REST API) from within your automation.
For example: Comparing the current state to an expected state. Think of a source of truth (such as YAML/JSON or a platform like NetBox) against the network's current state.
Installing Slurp'it
Slurp'it provides both an OVA image so you can import it as a VM and also Docker images that can be spun up using their helper scripts. Both of these can be obtained using the link below:

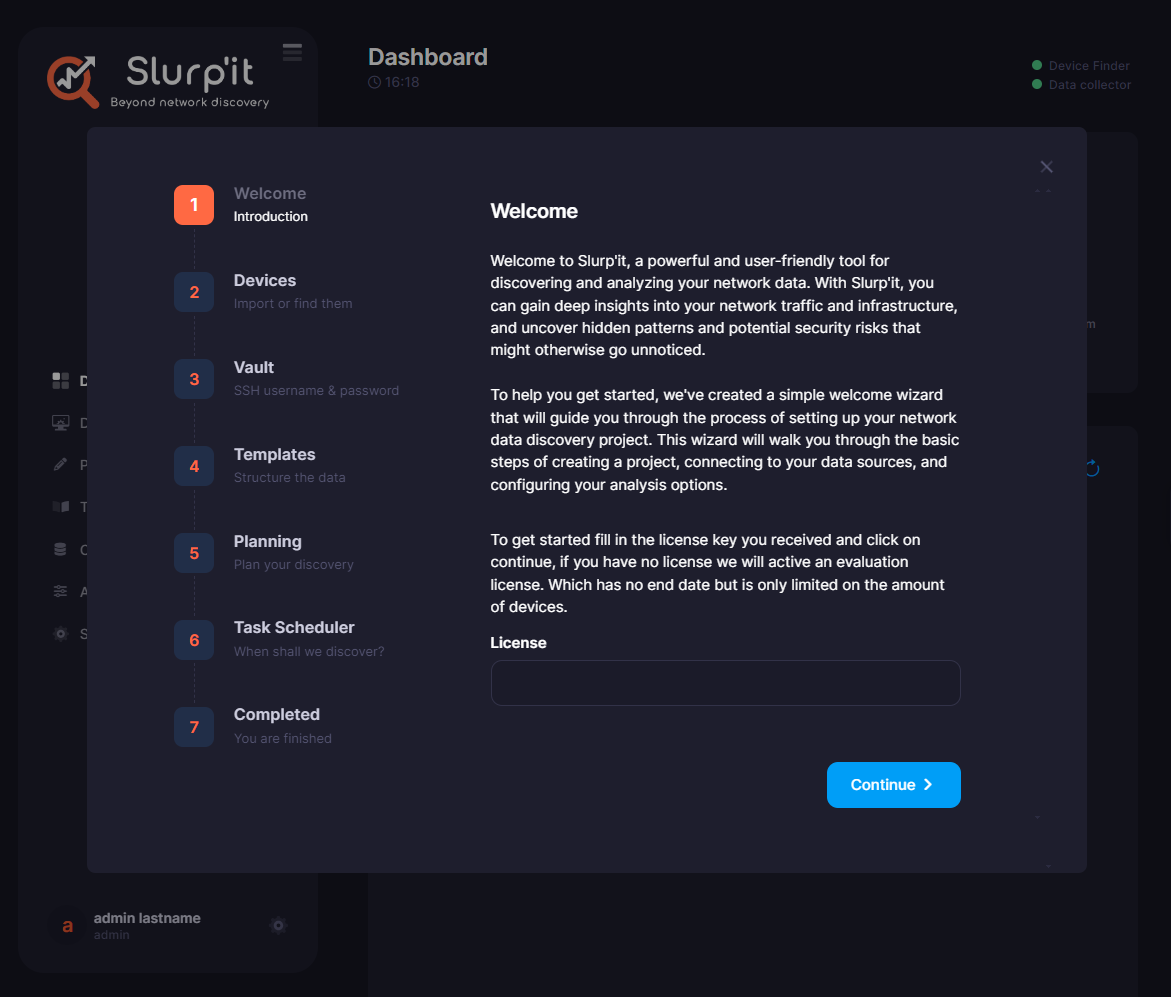
Once you`ve installed Slurp'it, you`ll be presented with a UI. Once you are logged in, a wizard will step you through the various tasks needed to get started, such as adding device credentials and details of the devices you want to scrape, either by adding them manually, via import or using the Device Finder (mentioned previously).
Slurp-It Features
Once you have Slurp'it up, here are some of the key features you can perform:
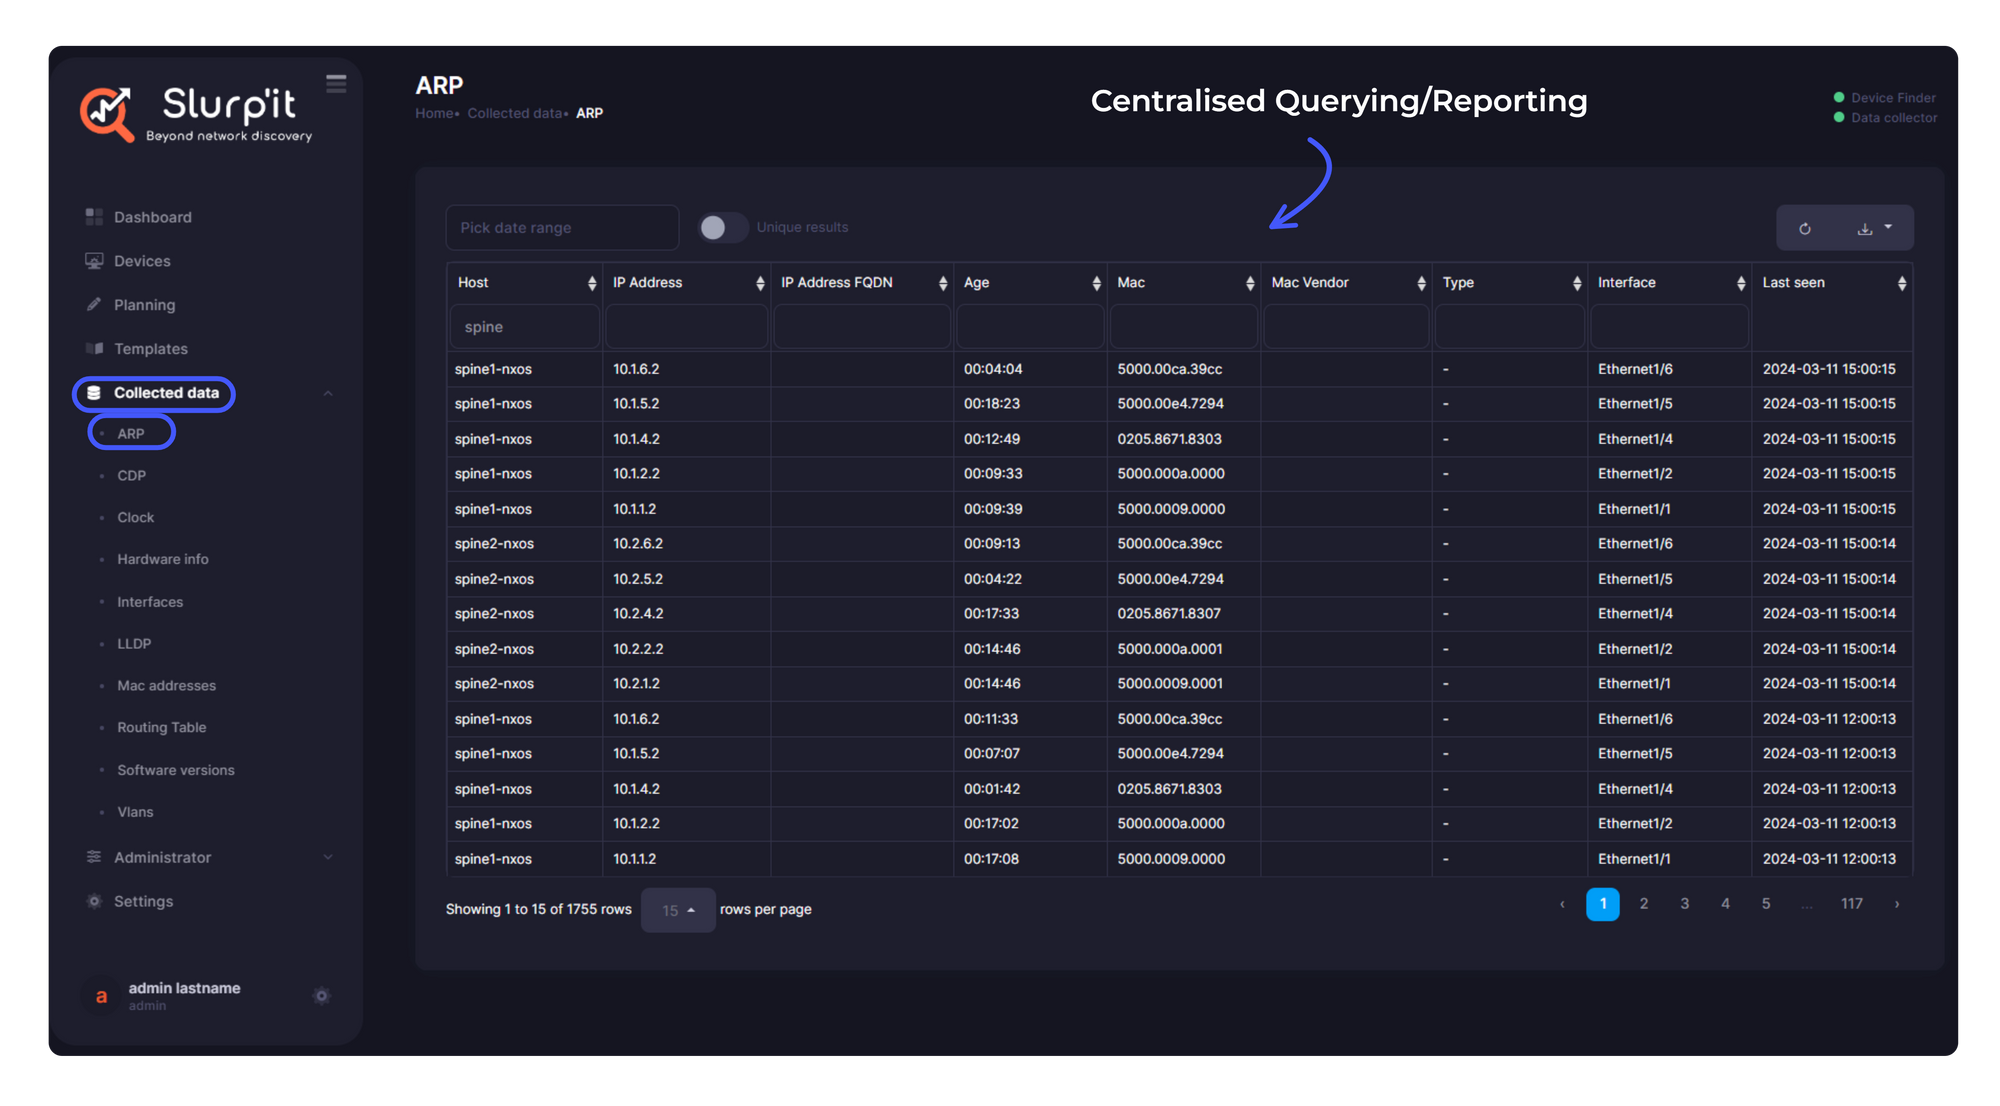
Centralised Querying/Reporting
As we mentioned before, you can query the collected data via the UI. You get the options of selected time ranges, filtering based on the various columns, and exporting the queried data into a PDF.
Common Data Model
The data that is collected can be mapped to a common data model.
For example, let's say you are running a show interfaces across 2 different vendors. The data is collected and parsed through a TextFSM template to ensure the data is structured. However, the resulting structure is different, i.e. the keys:
Cisco
[
  {
    "interface": "GigabitEthernet1",
    "ip_address": "192.168.1.1",
    "status": "up",   <== different key to Juniper
    "protocol": "up", <== different key to Juniper
    "duplex": "auto",
    "speed": "1000Mb/s",
    "type": "RJ45"
  },
  {
    "interface": "GigabitEthernet2",
    "ip_address": "192.168.2.1",
    "status": "down",
    "protocol": "down",
    "duplex": "auto",
    "speed": "1000Mb/s",
    "type": "RJ45"
  }
...
]
Juniper
[
  {
    "interface": "ge-0/0/0",
    "admin_status": "up", <== different key to Cisco
    "oper_status": "up",  <== different key to Cisco
    "physical_mode": "Full-duplex",
    "link_speed": "1Gbps",
    "mtu": "1500",
    "mac_address": "00:1B:63:84:45:C6"
  },
  {
    "interface": "ge-0/0/1",
    "admin_status": "down",
    "oper_status": "down",
    "physical_mode": "Half-duplex",
    "link_speed": "1Gbps",
    "mtu": "1500",
    "mac_address": "00:1B:63:84:45:C7"
  }
...
]
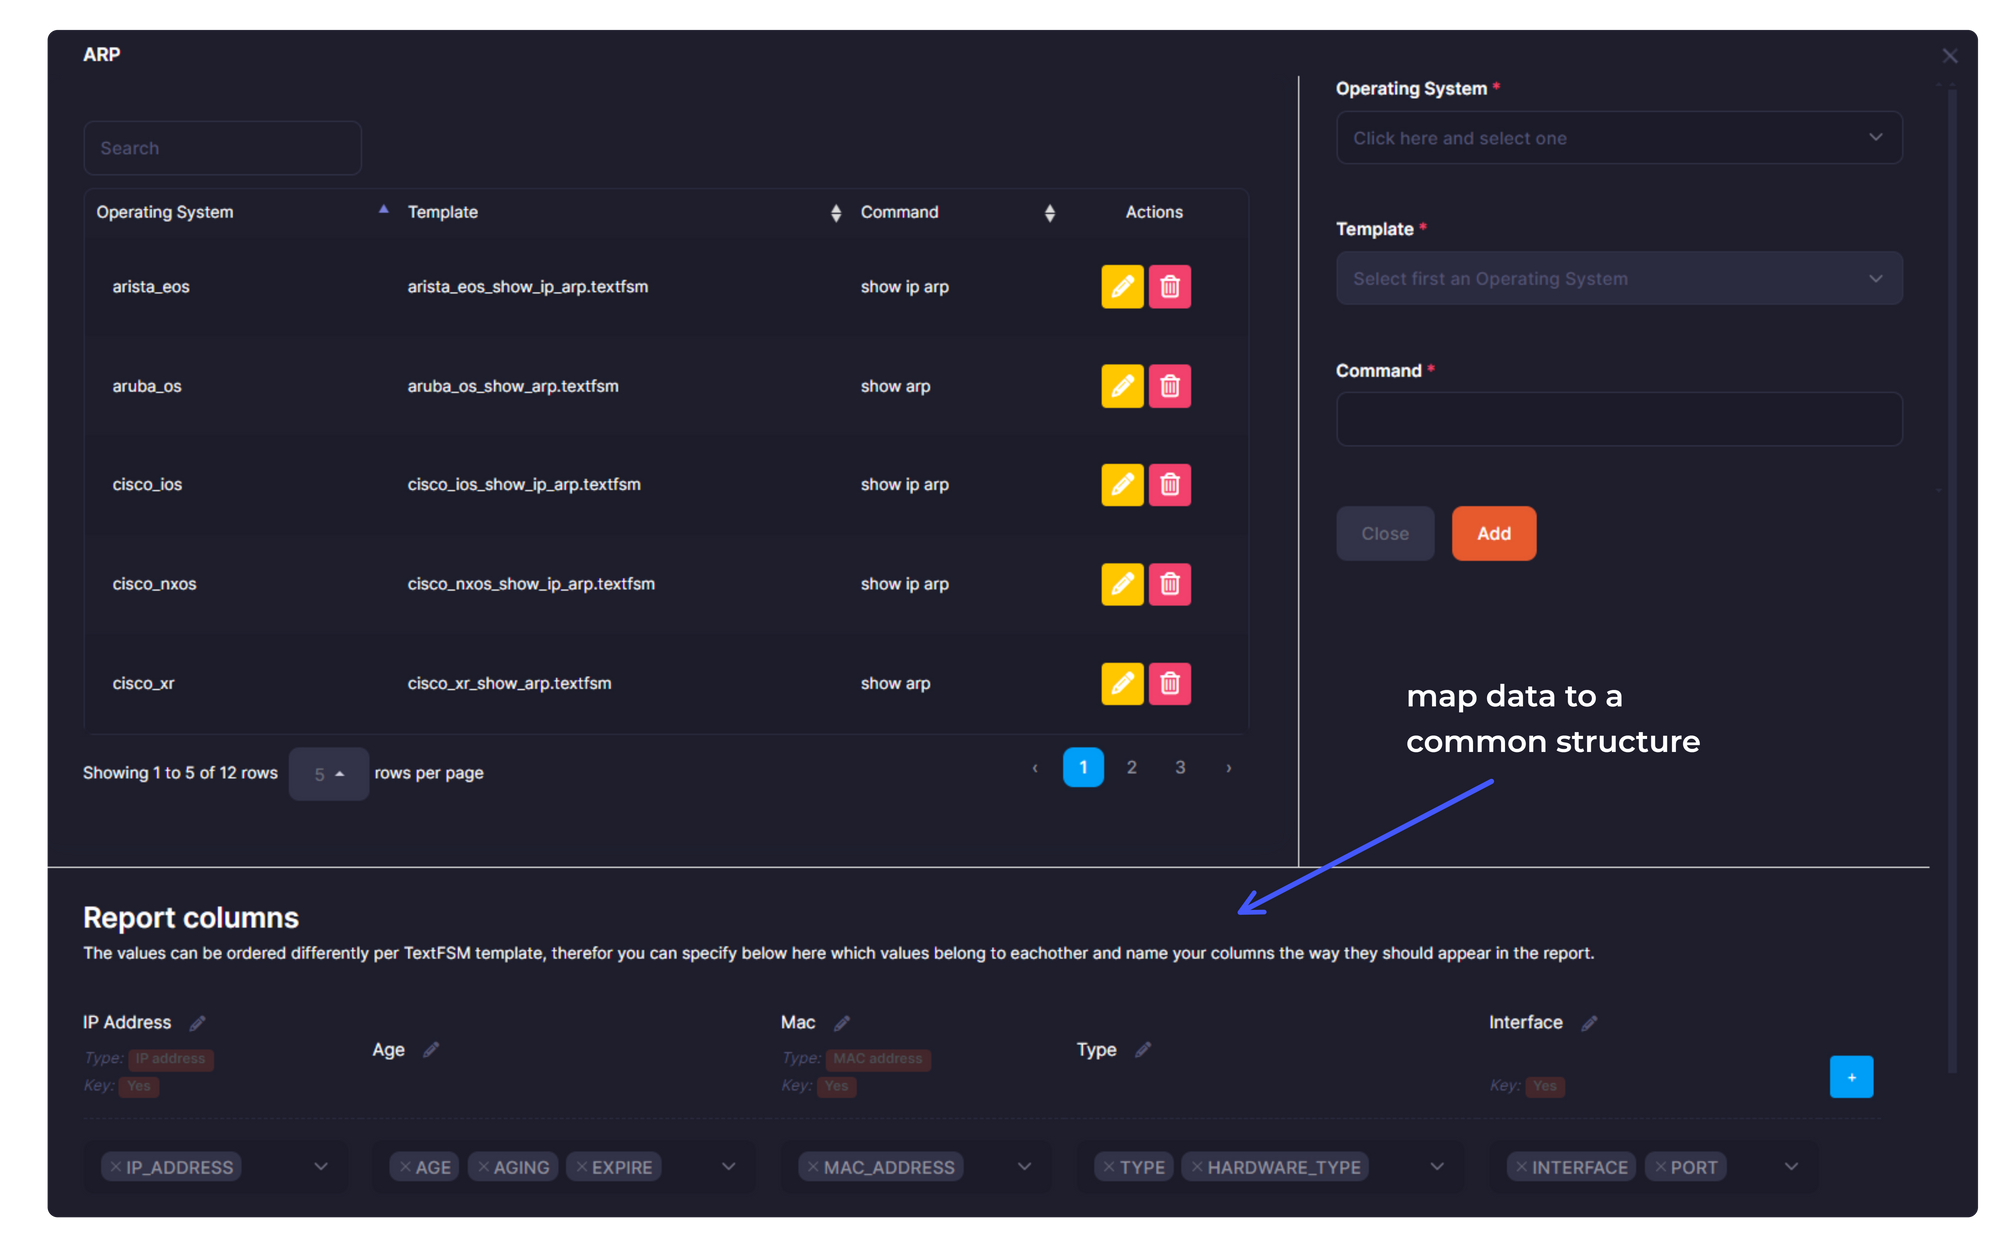
Slurp'it allows you to map the data from different keys into a common data model. This is achieved via a feature called Report Columns (below shows the Report Columns screen, used for this centralised mapping within the Slurp’It UI).
NetBox Plugin
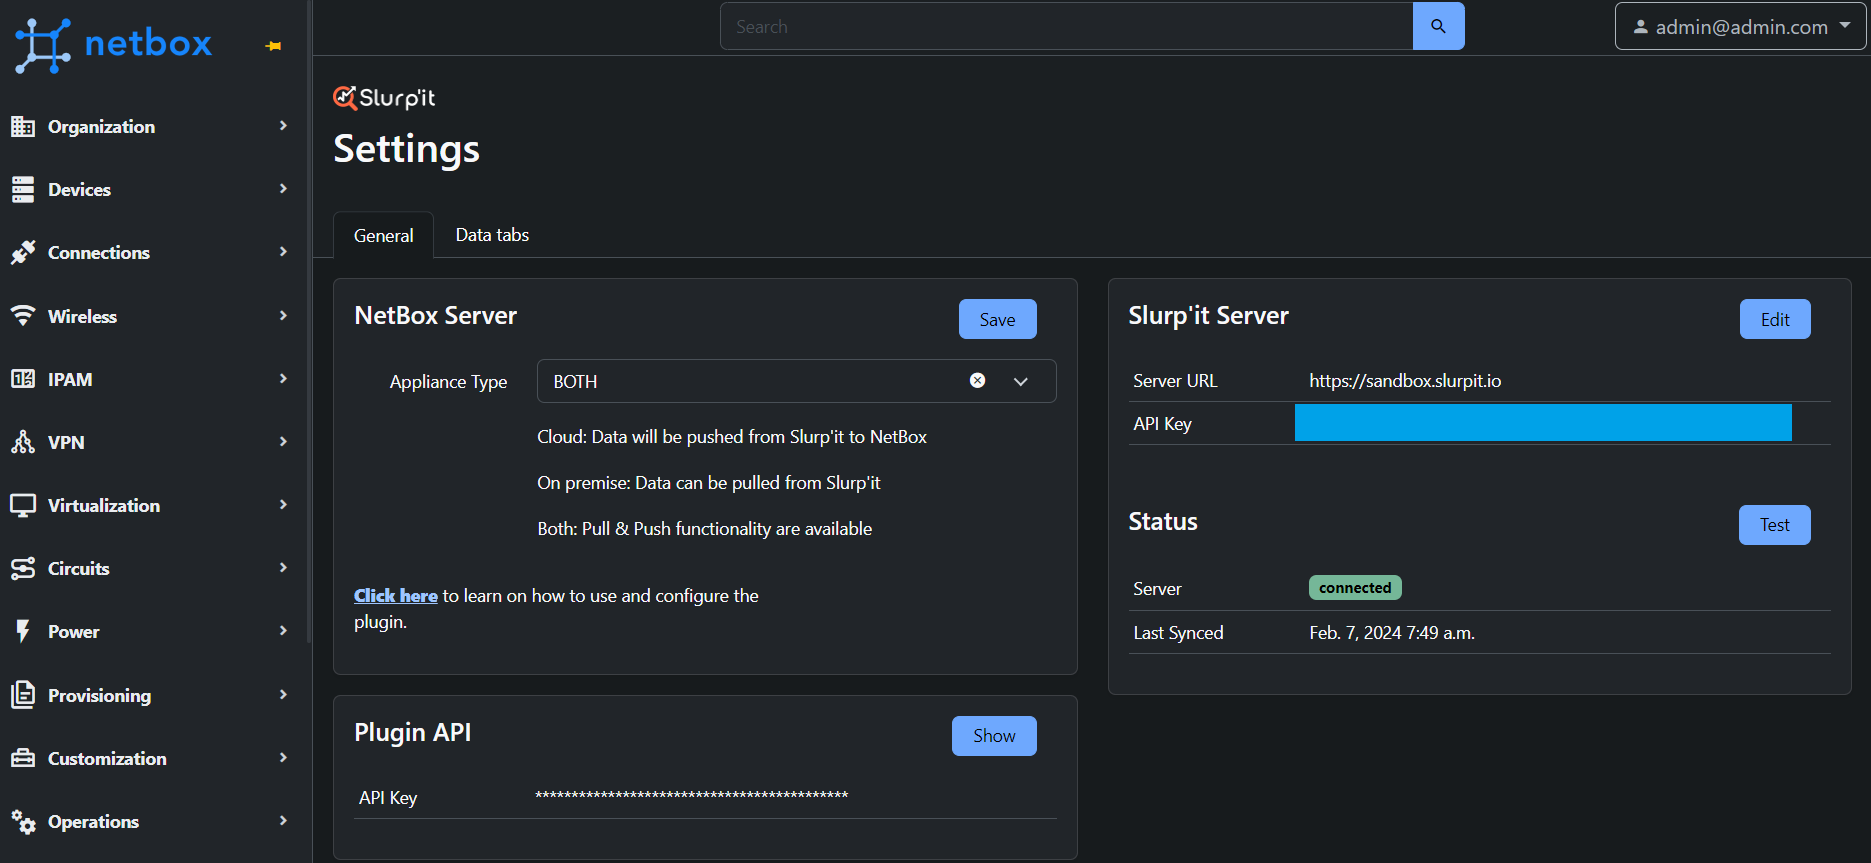
The other feature of Slurp`it worth mentioning is its NetBox plugin. Once you have the plugin installed in NetBox, you can perform either push- or pull-based synchronisation to/from NetBox to/from your Slurp’it instance. This is defined via setting the Appliance Type in NetBox. A quick summary of these “modes” are shown below:
| Appliance Type | Description | Use-Case |
| Cloud | Data push from Slurp'it to NetBox | Populate NetBox from what is running in the network. |
| On-Premise | Data can be pulled from Slurp'it | Populate the Slurpit inventory and device types with what is in NetBox |
| Both | Performs both of the above. | Both of the above. |
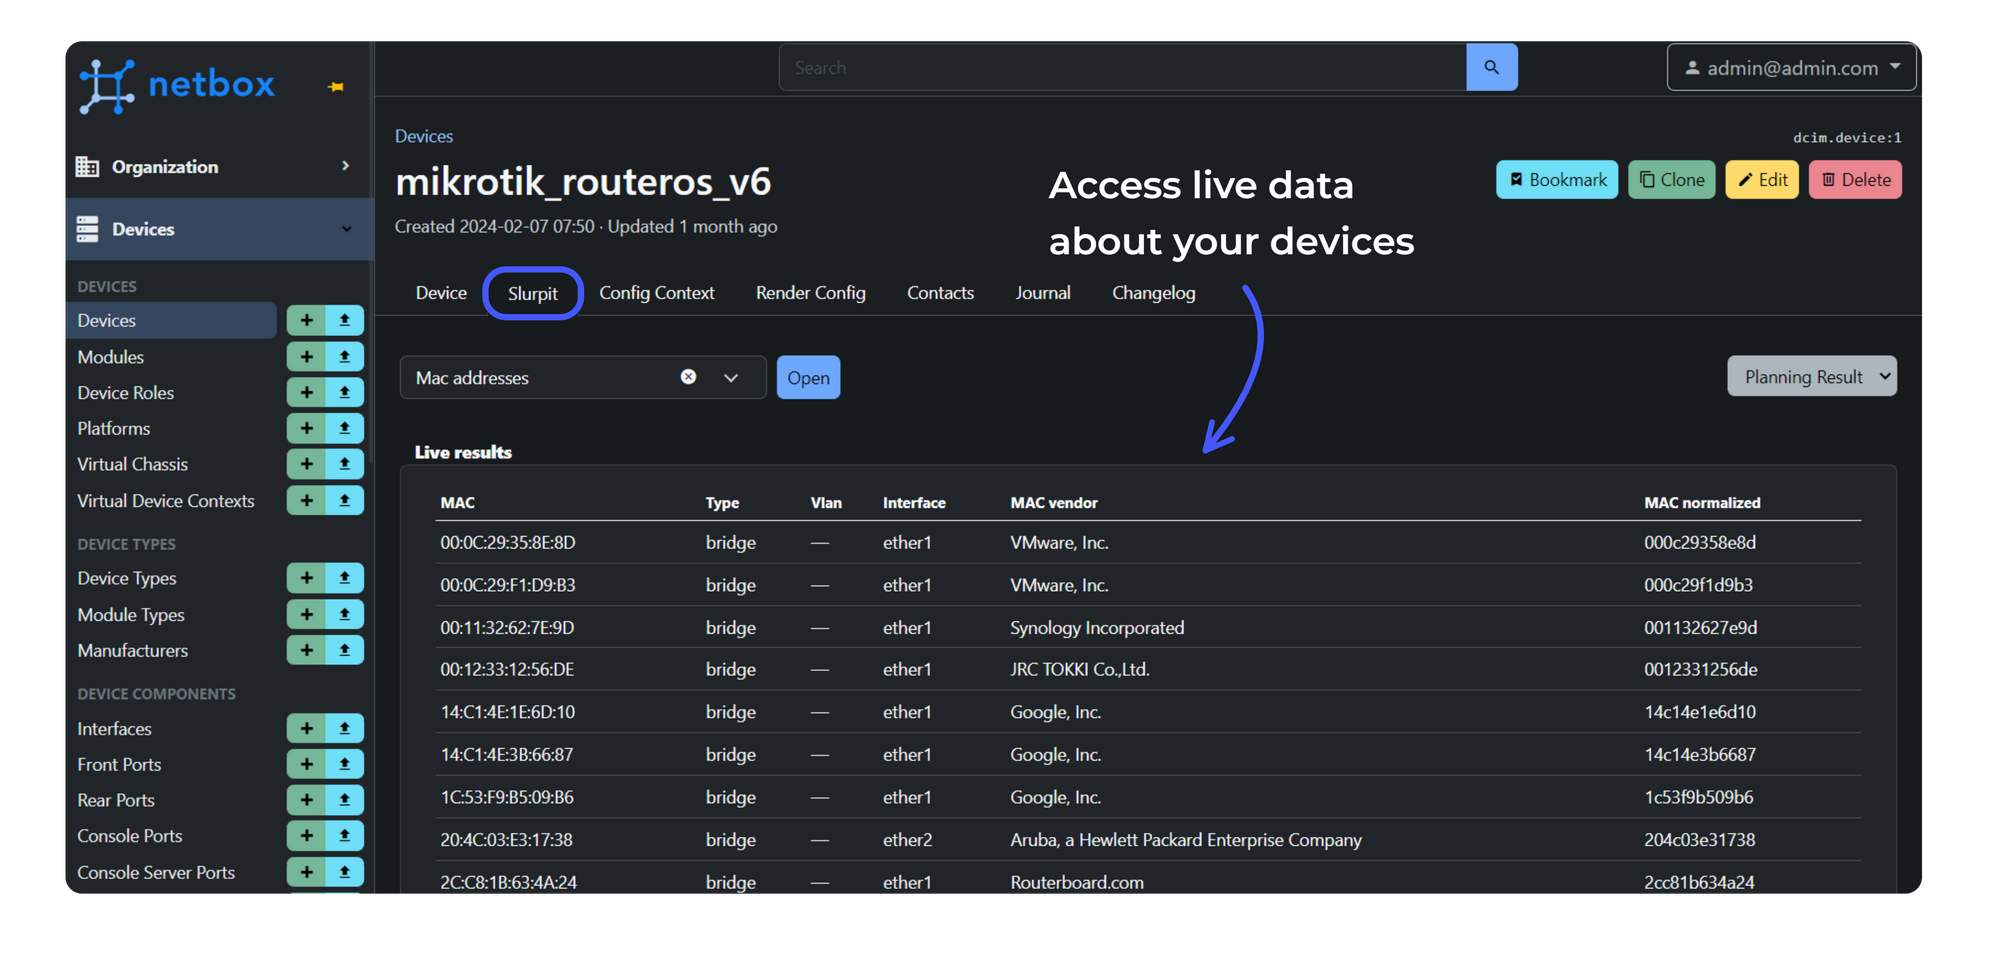
The other thing to know about the NetBox plugin is that it gives you live data about your network directly from within the device objects (see the example below).
Summary
We hope you have enjoyed this introduction to Slurp'it. There is no doubt that Slurp'it has a bright future. It has some great features, is easy to use, and can be easily customised.
Looking to Learn More?
If you want to learn more about Slurp'it they have various resources at the link below. Such as a sandbox, guides and download links. Happy Slurping!
👉 https://slurpit.io/getting-started/